I was recently asked “What is more in Kanban than a Taskboard and WIP limits”? Actually, there is a couple of tools that may help your Team become even more effective:
Discover Your Real Developement Process
Your Kanban board doesn’t have to be as simple as this:

It may look like that:

It all starts with a process of Value Stream Mapping, which later helps you craft a Kanban board corresponding to your process. Discovering a real development process is an insightful exercise itself – it helps the Team realise it’s more than “Pick a task, code and hand over to QA” 🙂
Measure, Chart and Improve Your Flow Efficiency
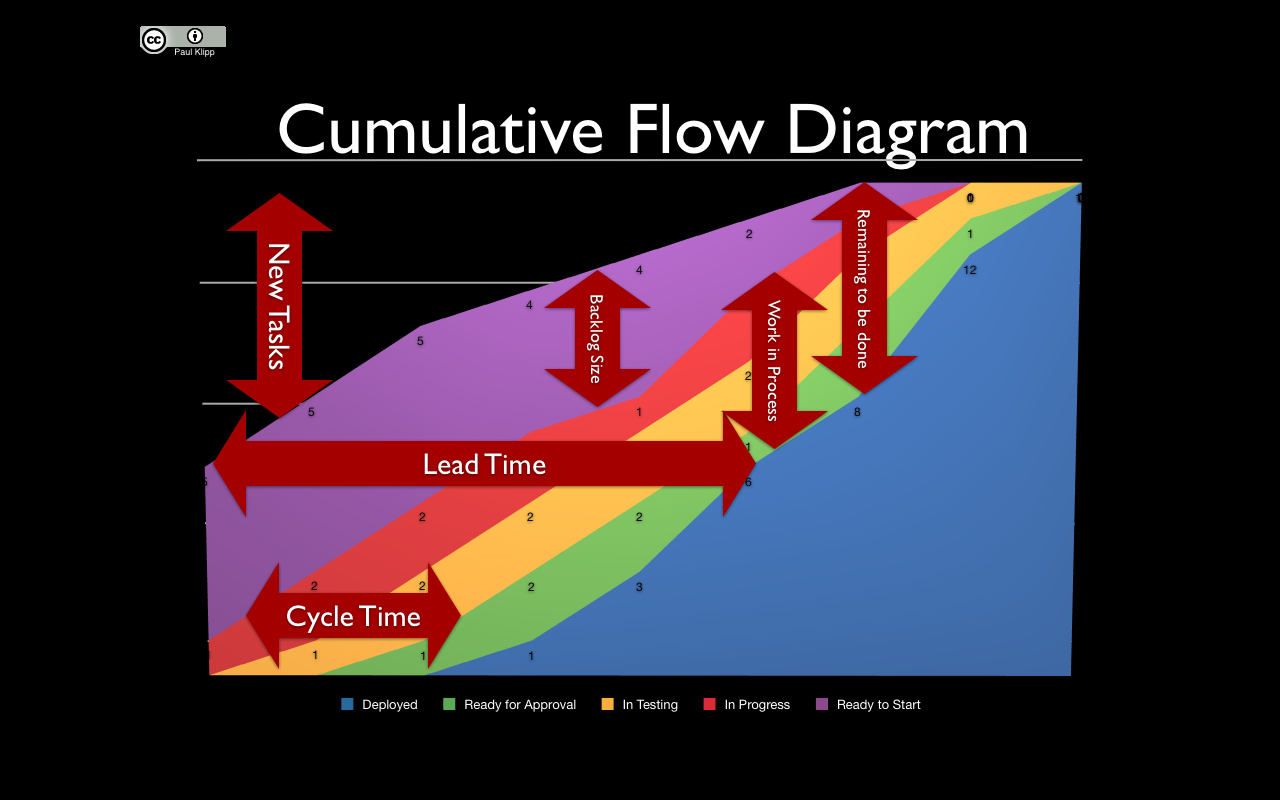
Cumulative Flow Diagram helps you look at your flow from the brid’s-eye view. As you can see here it’s a single chart that brings quite a lot of information:
That’s why when it comes to measuring and analysing average Lead and Cycle Times I prefer to look at the Control Chart that graphs these numbers for each task, like this one:
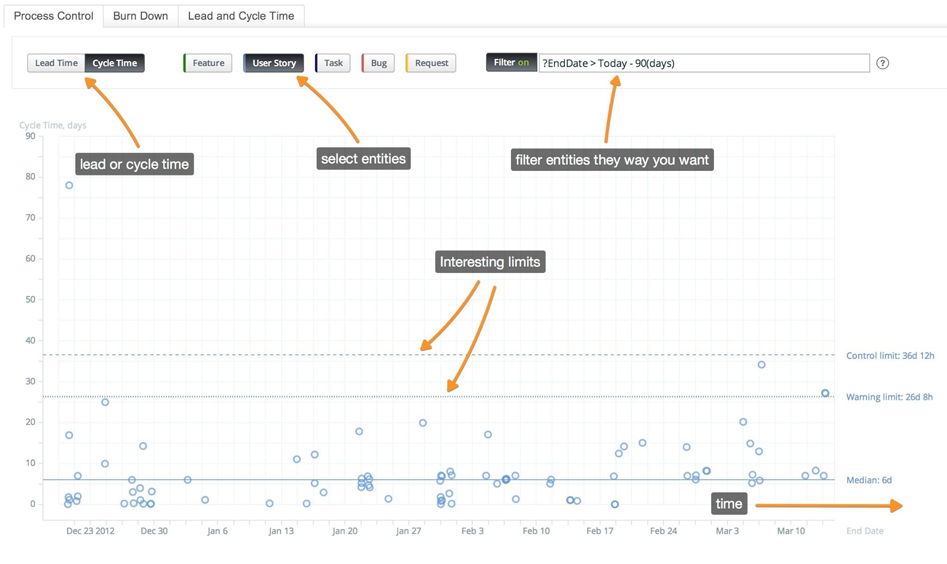
It might be interesting to analyse which tasks (and why) took significantly longer time to complete than usual.
Flow Efficiency
Another interesting measure in Kanban systems is Flow Efficiency, which is basically:

Let’s say you start working on a feature on Tuesday morning and finish it a week later. Usually, what happens meanwhile during this week is a number of activities not adding value to this feature like:
- waiting – e.g. waiting for graphics design, translation or QA
- multitasking – working on other items.
If the actual time spent on this particular feature by the whole team is 2 days, then the flow efficiency for this feature is 2 days (work time) / 7 days (time passed) = 28.5%.
Other Tools and Measures
These are just few examples of tools and measures related to Kanban. I haven’t mentioned Classes of Service that help you handle urgent and fixed date issues as well as Cycle Time Distribution analysis that helps you define Kanban Service Level Agreement.
What do you find useful in Kanban beyond a simple Taskboard and WIP Limits?
